A pre-registered confirmation of task-specificity of subjective state fatigue change is summarised here.
Background
Compliance has been shown to affect internal mental states (Yao & Neal, 2008) which, as opposed to traits, show dynamic development. In fact, different probes have been used previously to reliably infer about such constructs, i.e., mind-wandering during a Sustained Attention to Response Task (Robertson, 1997, Weinstein, 2018, Jackson & Balota, 2012). So, demand characteristics may interfere with self-report and thus cloud and inflate findings relying on subjective state measures (Vinski & Watter, 2012). Very little research has been conducted to scope the true extent of this bias (McCambridge et al., 2012), and a concern with the measured subjective state change lead to the design of a separate confirmation of task-specificity of VAS rises or whether the effect was caused by demand characteristics? In past experiments, fatigue has been induced via demanding tasks (Guo et al., 2016). Nonetheless without a fatiguing task, a change in state may still paradoxically occur due to attempt to modify performance according to expectation (McCambridge, de Bruin & Witton, 2012).
Method
Based on our previous data and anecdotal findings, we originally proposed (link) that even a non-fatiguing task will elicit detectable change in state fatigue levels compared to baseline. To achieve a minimal informative sample, an inclusion of 12 elligible participants was warranted by a power calculation using the ‘pwr’ R (R Core Team, 2013) package to allow the detection of a large effect d = 0.8 with a one-sided hypothesis (Cohen, 1988). The large effect was based on a previous closely related finding (link), where a relatively undemanding 50-minute-long task showed a difference between initial and final state fatigue levels greater than one standard deviation in overall state change. To pick appropriate non-fatiguing stimuli, infotainment Youtube videos were chosen, based on a recent survey (Sivianetri et al., 2022) showing that 88% of students enjoyed infotainment when watching Youtube videos. Furthermore, according to Statista reports, an average Youtube video was longer than a SART block (at 11.7 minutes in length) (Pex, & Rain News., June 10, 2019). Therefore, to simulate an entertaining environment, three Youtube videos were chosen to be displayed to the participants, totalling in duration to 50 minutes and 28 seconds. All were popular informative videos about scientific concepts. The participants’ gender, age, recent Covid testing, levels of caffeine consumed, and hours of sleep were reported similarly to the SART experiment. Then, an empty and comfortable EEG cap system was mounted on the head (to facilitate comparison with previous experiments) and a Visual Analogue Scale for Fatigue (VAS, Lee, Hicks & Nino-Murcia, 1991) was completed. Participants were then asked whether they were well hydrated, comfortable and able to stay in the room for 50 minutes. Then, they completed a task with only the following instructions given: “I would like to ask you to sit in this chair for 50 minutes. I will play some videos to you which you can watch to pass the time if you wish. I will not ask you about anything relating to the content of the videos later, this is not a memory experiment. I will sit in the box next to you and ask you not to speak to me during that time. I will set the alarm to 50 minutes from now. Any questions?” Following the video watching session, the participants were again be administered the VAS. Then, the participant were partly debriefed using the following text: “Thank you very much for your participation! In order to collect valid data, we could not be explicit about the focus of this study. This was unavoidable, so below is the information regarding the study. Please read it carefully. The experiment’s aim was to investigate “demand characteristics”, or the experience of taking part in an experiment and its impact on subjective mental states. We administered you an identical questionnaire measuring momentary fatigue levels before and after the experiment. The experiment was not particularly fatiguing, so any experienced rise in subjective fatigue levels may have been due to performance expectations. If you became suspicious of the nature of the experiment, you are still fully entitled to the payment, but we will not consider your data in the main analysis.” They were then asked one question to confirm suspicion: Did you suspect this to be the case? And a clarifying question: Please describe what you thought this experiment was about: Participants then received a full debrief and compensation for their participation similarly to the SART experiment. If they showed any suspicion of bias as detected in the answers to the follow-up questions, their was not eligible for analysis of VAS changes, while they still received compensation. Nevertheless, the inclusion of participants suspicious of demand characteristics did not impact the effects detected in the findings.
Results
In the end, 16 participants were recorded, 2 excluded based on direct answer of yes to one of the follow-up questions and 2 based on their qualitative reports:
20007: The participant become more fatigue significantly because of their performance expectations
20002: I thought the experiment was possibly about the placeblo effect and fatigue. I had it in my mind that the experimenter was looking to see if me participating in an experiment on neurofeedback interventions for fatigue would reduce the levels of fatigue that I felt
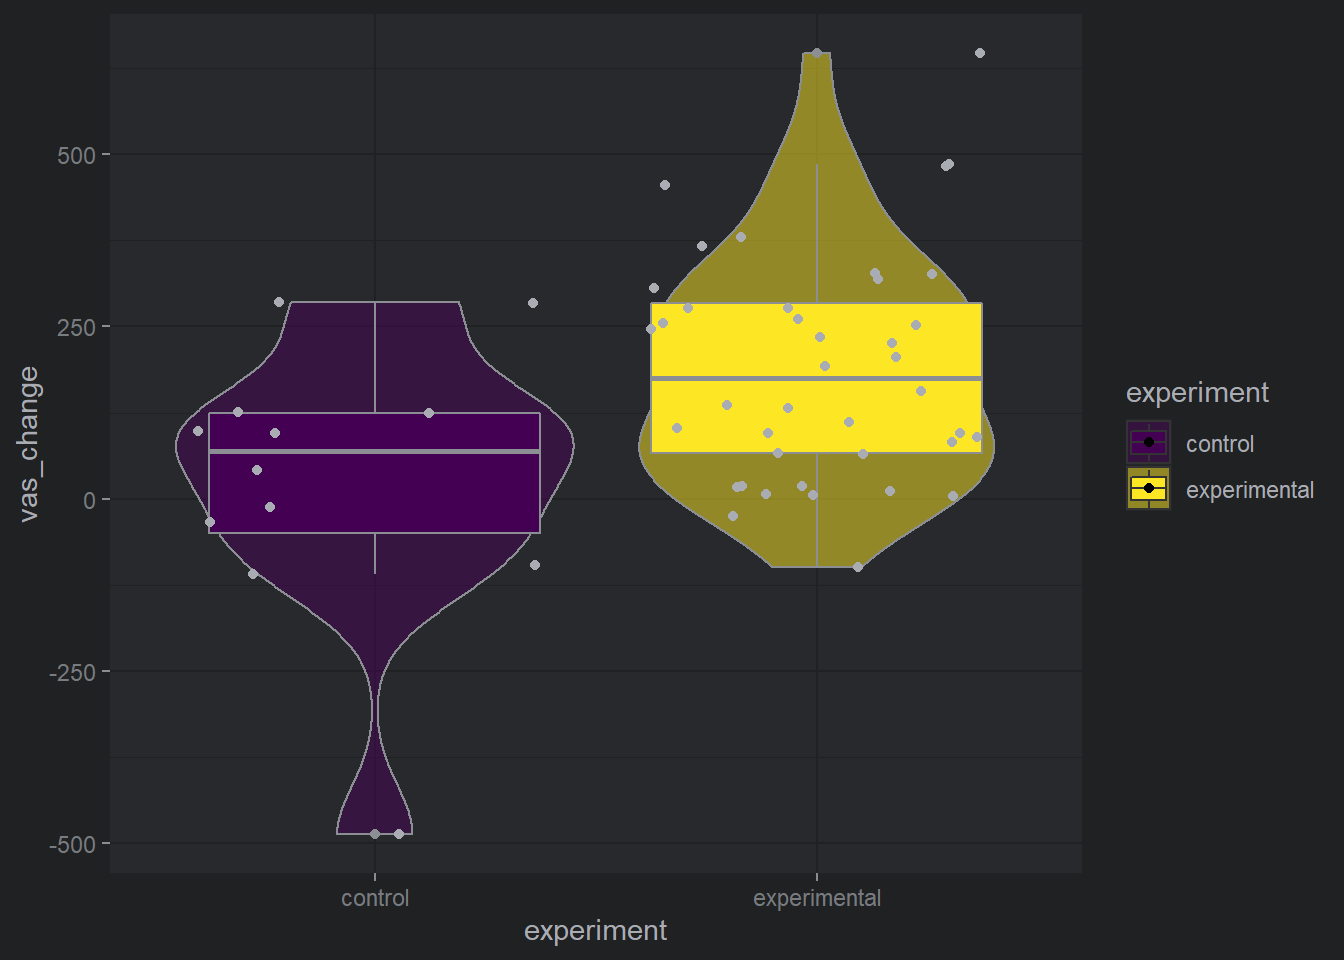
A comparison of VAS change in the control experiment and the sample from the main SART experiment showed a notable difference between the two F(1, 50) = 8.10, p = .006, as seen in Fig. 1.
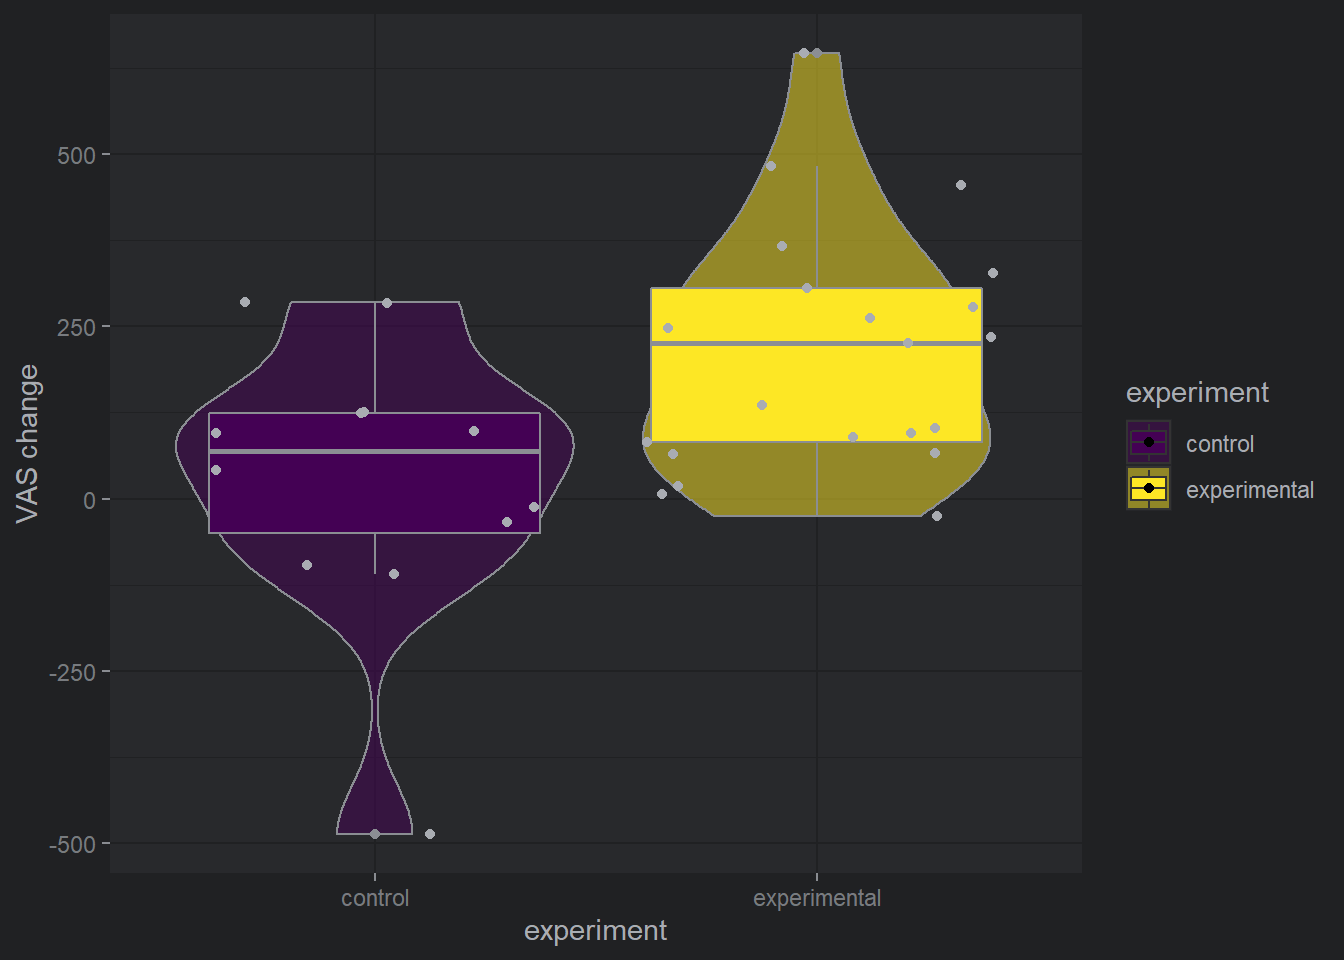
 with participants in the main experiment showing much higher levels of VAS change. The effect was present even with the inclusion of participants suspicious of their own demand characteristics (F(1, 54) = 6.58, p = 0.01). Or with exclusion of older participants from the comparison (F(1,31) = 7.6, p = .01), see Fig. 2.
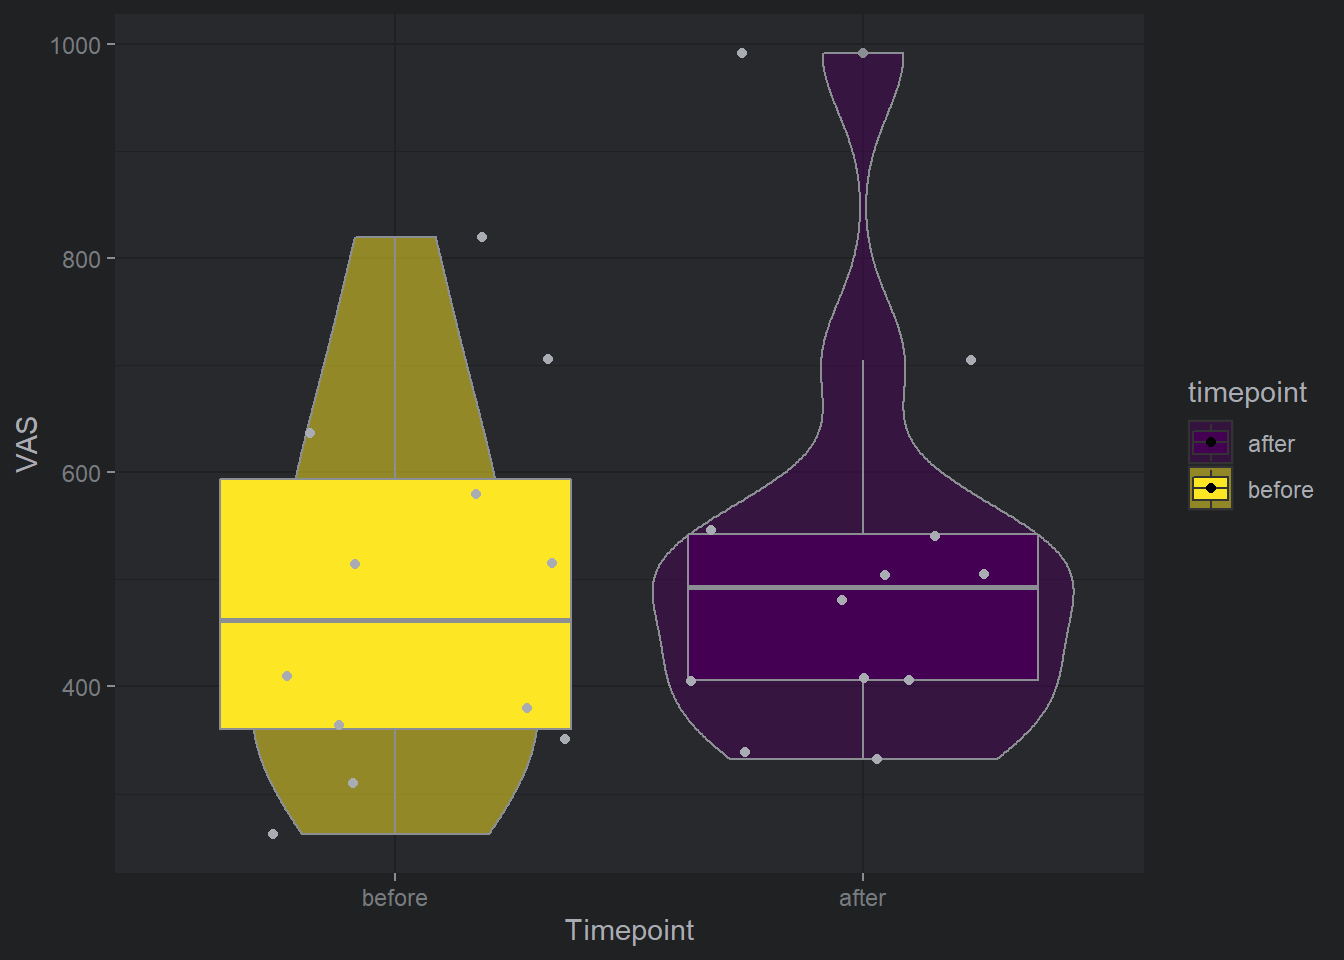
 Conversely, the VAS change scores before and after the experiment were not significantly different on a Welch one sample t-test (t(22) = 0.36, p = .360), even when including participants suspicious of their own demand characteristics (t(30) = 0.83, p = .206). For comparisons of the two change scores, see Fig. 3.
