Details of further exploratory tests.
Visual field test
Participants’ visual abilities were assessed using a simplified visual field test. One young participant experienced a technical fault which invalidated their data and lead to exclusion from the visual field test analysis.
Both young (mean = 98.13 %, SD = 3.27 %, range = 87.50% – 100%) and older participants (mean = 96.22%, SD = 4.49%, range = 81.25% - 100%) showed high accuracy in detecting the targets. The results of the visual acuity test are depicted in Figure 2. Smaller red squares indicate the positions of visual targets In later tasks. Finally, the fixation point is marked by a plus sign. The graphs represent the entire span of the screen.
A Welch Two Sample t-test was used to test for age differences in percentage visual detection accuracy (2 x age groups: young vs older). There were no significant differences between the young and older groups across the full tested visual field [t(33) = -1.51, p = 0.14, 95% CI -4.48 – 0.66].
Descriptive detail
Overall behavioural performance was tracked on the metrics of reaction time. commission error and the computed index of inverse efficiency, which are depicted in Figure. Omission error showed ceiling effects both in the young (0.21%, SD = 1.15%, range = 0 – 12.5%) and older (mean error = 0.80%, SD = 2.03%, 0 – 13.89%) participants, alongside a heavy skew, leading to difficulty analysing it using linear models. Overall performance for the young participants averaged low (mean = 429.45ms, SD = 50.37ms, range = 328.88ms – 577.67ms) reaction time and (mean error = 24.46%, SD = 13.19%, range = 0%-61.11%) commission error, while for older participants this was notably reverse with higher (mean = 567.66ms, SD = 95.18ms, range = 429.99ms – 923.98ms) reaction time and lower (mean error = 7.72%, SD = 7.48%, range = 0-33.33%) error. Two subjective state changes were tracked before and after the main experimental session of 8 blocks. Subjective fatigue levels were already present at the beginning of the experiment both for young (mean = 588.89, sd = 257.61, range = 118 - 1054) and older (mean = 427.56, sd = 201.22, range = 104 - 755) participants. Likewise, both young (mean = 4.07, sd = 1.71, range = 1 - 6) and older (mean = 3.70, sd = 1.61, range = 1.25 – 6.50) participants showed fairly low initial levels of mind wandering.
A type of analysis of baseline state fatigue levels was not greatly indicative as baseline subjective state levels are highly variable and so subjective fatigue change levels were calculated. Generally, both young (mean change = 217.06, sd = 182.29, range = -25 - 646) and older (mean change = 169.31, sd = 149.58, range = 3 - 485) participants reported a rise in their subjective fatigue levels. And likewise both young (mean change = 0.53, sd = 1.00, range = -0.75 – 2.50) and older (mean change = 1.11, sd = 1.28, range = -0.50 – 4.25) participants saw an increased mind wandering rate.
Task-related alpha cluster
The task-related baseline-corrected decibel-transformed test did reveal another significant cluster, indicating a decrease in the alpha oscillatory band with the progress of task.
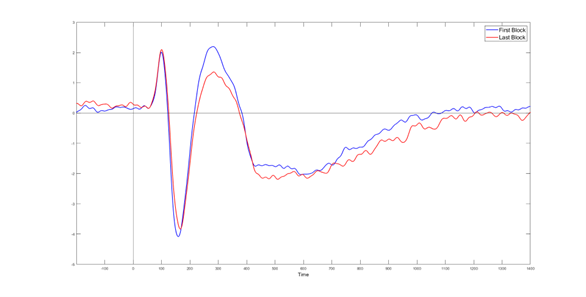
However, as the task-related alpha oscillatory cluster occurred in a very early time window (250ms – 500ms), a follow-up analysis was conducted to determine whether the cluster may be driven by a change in a task-related ERP pattern, rather than of alpha oscillatory activity more related to attentional processes. ERP curves from the same time window of signal coming from top lateralised electrodes detected as significant by the cluster permutation (PO7 and PO8) were compared and corresponding positive peak extracted (280ms), see Fig. 1. Running a one-sample paired t-test on the difference between early and late curves at this time point show a high difference (t(33) = 3.35, p = .002). This implies that the appearance of a time-frequency difference cluster is likely driven by the presence of this ERP. This pattern of activity marked by an increase around the 300ms mark after stimulus onset has been labelled the P300 (Pickton, 1992) and noted to indicate active engagement with the task. As decreases in this activity occurred in the last block when compared to the first block, they follow the parallel decrease in the alpha cluster contaminated by this effect. The pattern is also related to similar findings (Arnau, 2021) and replicates earlier detected effects of fatigue on ERP (Sabeti et al., 2018).
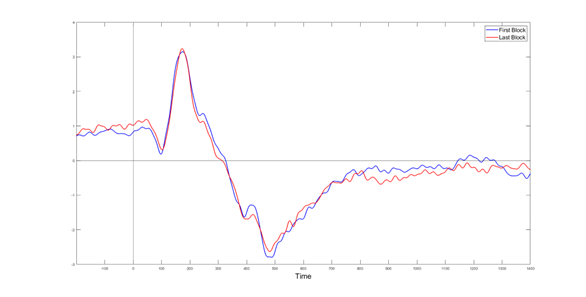
 Due to a suggested possibility of impact of remaining ocular artifact on the emergence of the beta cluster despite its variable and later offset, a similar analysis was conducted on ERP in the acquired EOGs prior to ICA removal of the associated components. The resulting plots (Fig 2) indicated two main detectable peaks, a positive peak occurring at the 200ms mark and a negative peak at the 500ms. However, the peaks preceded the cluster effect and did not suggest and difference between the first and last block. Likewise, a follow-up t-test at the 500ms mark detected no relationship (t(33) = -0.76, p = .450). This suggests that the presented beta cluster was likely not affected by ocular artifact.

Covid
8 participants self-reported experiencing Covid-19 symptoms and testing positive for Covid up to 3 months prior to participation. This warranted the exploration of the variable by a non-parametric Wilcoxon rank sum exact test used for comparison of samples of asymmetric size, in this case recently Covid-positive participants with other The test did not yield a statistically significant difference between the groups on reaction time (W = 146, p = .0924), commission error (W = 58, p = 0.065), state vas change (W = 73, p = 0.216) or mind-wandering change (W = 79.5, p = 0.3281).
Pre-stimulus alpha levels were also compared using cluster permutation in the two groups, lending to non-significant results.
#Sleep Based on some anectodal evidence during experimentation, the resting by connecting the hours of sleep of individuals on subjective state fatigue change using a linear regression, however, the relationship was not statistically significant (F(1, 38) = 2.49, p = .123).